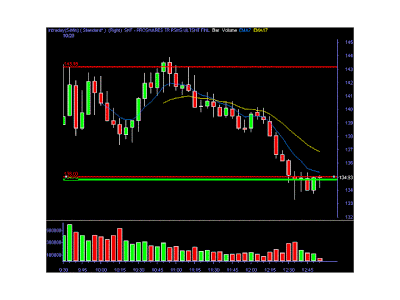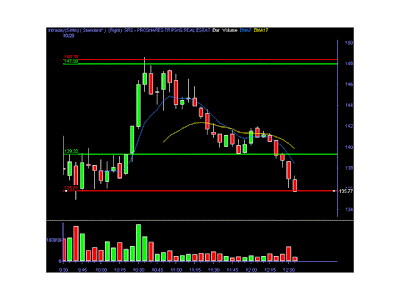
Maybe this will clear up some confusion. This is my last trade from yesterday. Lower red line show intial entry. Higher red line shows where I doubled up.
Green line shows where I sold right before the market closed for the day.
There was a feeding frenzy going on and I sold into that strength. I think it went up another $3 or $4 from where I got out.


