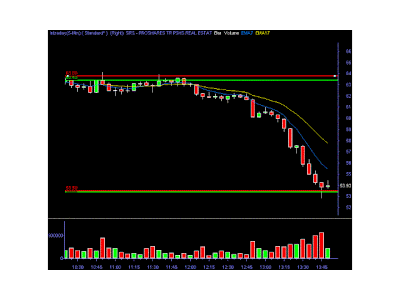
I submit to you that in these fantastic trading times we currently live in , the former benchmarks of fundamental and technical analysis are almost worthless.
I've been thinking about this concept for a while but have just recently given it the name "Momentum Analysis".
When you look at what has happened to the market this year and the speed at which it has fallen, those traders who are stuck using the "old ways" have surely suffered. All the bottom calls and price level proclamations are still going to be worthless going forward because no one knows how much more dirty laundry has yet to be discovered. How the far flung effects of seemingly disconnected world events can come together to either wreck havoc or become a catalyst for massive upswing cannot be determined.
Fundamental analysis is totally useless, technical analysis is virtually useless.
It makes sense then to take a shorter term view of the markets to be able to capitalize on the violent swings up or down.
Momentum analysis is essential in determining what side of the trade is the winning side and to get onto it. As my postings this year demonstrate, it is safer to be nimble and quick to change direction when the trade dynamics have changed. Big losses do not occur when a trader is not married to an idea of where a stock is headed.
I firmly believe that momentum is easy to spot long or short once you now what to look for:
1. A rise or drop in volume after a trend.
2. Longer or shorter candles
3. Markets and stocks moving in sync with each other.
4. Price acceleration/deceleration
Pare your indicators down to these few and immerse yourself in the flow. Getting into the flow and rhythm of the markets allows you to stretch out those daily price movements, maximizing your return.
Speaking of price, I had an interesting experience this fall on one of those super volume days. My chart feed froze up but my price and Level 2 data continued. I changed tactics from chart watching to watching only the clock and price level rapidly changing. Making fast written notes of price levels vs time that maintained themselves more that the rest I was able to determine some supply and demand levels and also the trend. I usually don't watch price levels very closely until I'm ready to change a position so this was somewhat new to me.
What is interesting was that in stripping way all the modern indicators, I was left with only the essence of trading - negotiation of price between buyers and sellers. It's what the old timers did before they used charts. Maybe there is a "chart package" that performs this, I don't know. But it works. Charts and indicators give you a record of the past. The momentum I saw from the price fluctuations vs. time told me where the future in probability was.
If you can key into this, you can key into one of the most important aspects of trading and the only "real time " indicator out there. Momentum.
Sunday, December 28, 2008
Friday, December 19, 2008
Thursday, December 18, 2008
That's all for 2008
Wednesday, December 17, 2008
Subscribe to:
Posts (Atom)


